Because a matrix is the best way to visualise table settings, I developped a program in Excel. See the demonstrations on YouTube.


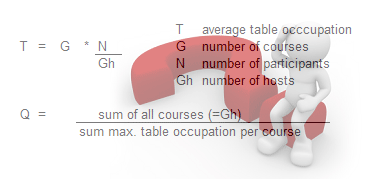
(figure above). After input of number participants, preferences, exemptions, max.nr. of guests each can accommodate at home and the preferred roulation (either individual or as a couple), the program first calculates if there is a chance to a solution in which nobody meets twice. The chance to that is equally increasing with the Q (see formula in first column). If Q<1 no solution is found, caused by too little hosts and/or too many exemptions.
When Q>1 the search for a solution is highly dependant on the way the different courses are distributed amongs the participants. Therefore ...

Therefore my program is equiped with a module to change that setting at random almost infinite. After calculation of the necessary number of hosts for each course (2, 3 or 4 courses possible), these are being distributed amongs the hosts, taking into account the known preferences. After that the program will add guests to each host, taking into account the max.number (filled in on forehand) and the table-settings in the past: the program will first add guests who never (or the least) visited the host before.
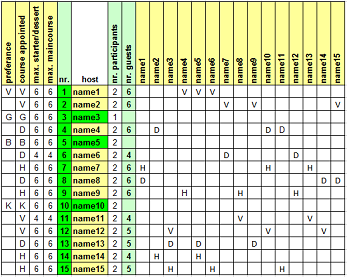
See figure on top of column 2: there a solution is found for 14 couples and 1 individual. The latter (name3) is exempted from a course, as are also name5 and name10. These two are exempted because they respectively take care of the drinks (B) at the start and the coffee (K) at the end of the Rdinner. Name1 had a preference for a starter (V). Names coloured green are exempted from a course.


.png)
.png)